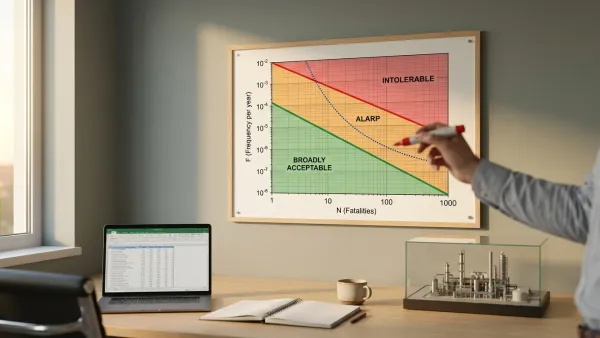
F-N Curve and Societal Risk: Drawing the Line on Safety
An F-N curve maps the societal risk a regulator will tolerate. Here is the math, the slope, the ALARP carpet, and where each sector draws the line.
Risk analysis methods and case studies.
An F-N curve maps the societal risk a regulator will tolerate. Here is the math, the slope, the ALARP carpet, and where each sector draws the line.
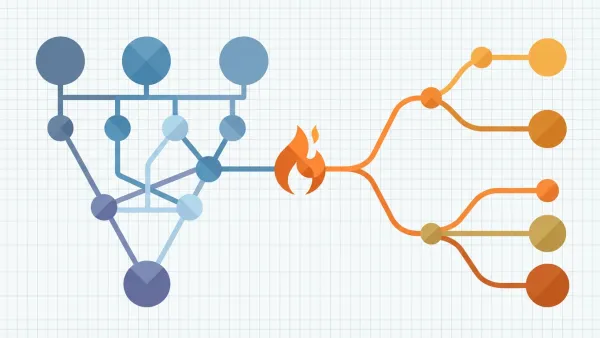
Event tree vs fault tree: one tracks causes backward, the other tracks outcomes forward. Here is how fire engineers pick the right one.