Event Tree vs Fault Tree: Picking the Right Fire Tool
Event tree vs fault tree: one tracks causes backward, the other tracks outcomes forward. Here is how fire engineers pick the right one.
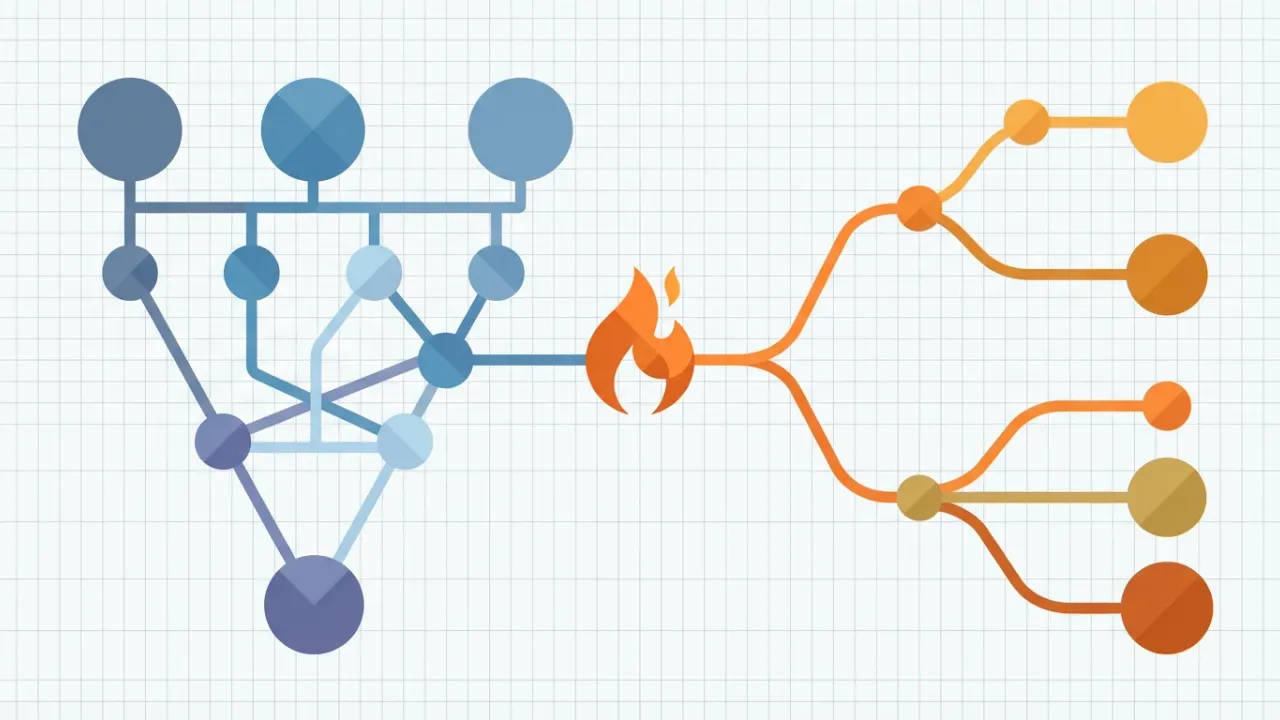
A fault tree asks how can this fire happen? An event tree asks given it has started, what happens next? One walks backward from disaster to root causes. The other walks forward from a spark to outcomes. Confuse the two, or use only one, and the risk picture goes blurry. Fire engineers lean on both. Moreover, regulators now expect both. This post walks through each method, shows a warehouse worked example, and says when to pick which.
TL;DR
- A fault tree works backward from a bad outcome to its root causes; an event tree works forward from a trigger to its outcomes.
- Fault trees use AND/OR logic gates, and a single-event “minimal cut set” flags a single point of failure.
- Closed main valves alone cause about 61% of sprinkler failures — a textbook single-event cut set.
- Event trees multiply barrier probabilities to give the frequency of each end state, from a minor fire to a catastrophe.
- In a worked warehouse example, the fault tree gives roughly 5 × 10⁻⁴ major-loss events per year; the event tree isolates a 2 × 10⁻⁶/yr fatality path hidden inside it.
- A bow-tie diagram fuses both lenses on one page and now anchors UK COMAH and Seveso III safety cases.
Fault trees work backward from a bad outcome
Fault tree analysis came out of a 1962 Bell Labs project. In short, H. A. Watson built it to study the Minuteman I launch system. A year later, Dave Haasl at Boeing pushed it into wider use. The U.S. Nuclear Regulatory Commission then codified the method in NUREG-0492. NASA followed with its own handbook. The formal standard today is IEC 61025.
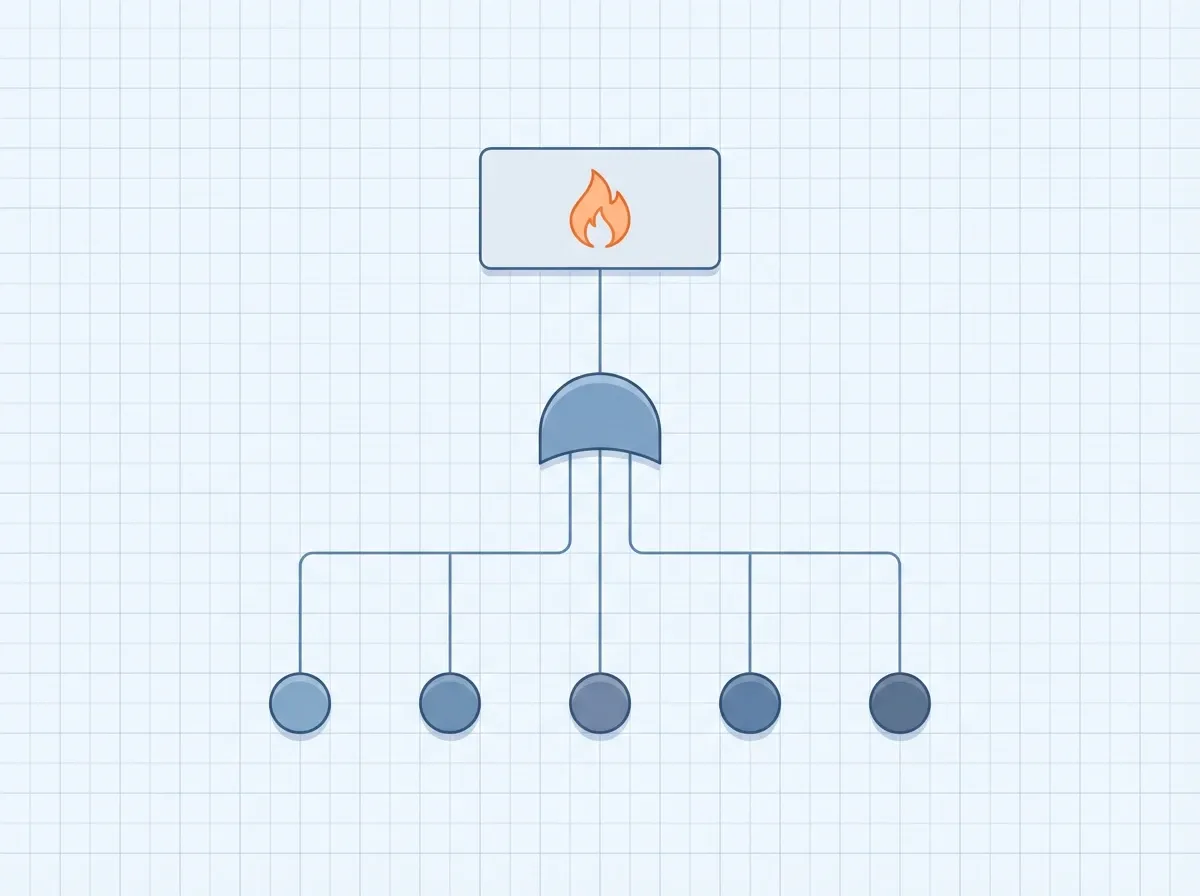
The method runs top-down. First, you pick one bad top event. For example: a sprinkler fails on demand. Then you trace downward through logic gates to root causes. Each gate uses AND or OR. AND gates multiply probabilities; OR gates sum them for small values. You keep going until you hit basic events — a closed valve, a dead pump, a missed check.
Two outputs really matter. First, minimal cut sets show the smallest pair of events that trigger failure. A one-event cut set marks a single point of failure. Second, the top-event probability falls out of the math. Fault tree analysis is rigorous. However, it stays static and binary. Timing and recovery do not show up on their own.
Event trees work forward from a trigger
An event tree grew out of the 1975 Reactor Safety Study. MIT’s Norman Rasmussen led the work. His team built about 130,000 candidate accident paths and filtered them to 650. Pairing fault trees with this forward tool became the core of modern fire risk math. The formal standard is IEC 62502. It also appears as technique B.5.6 in ISO 31010.
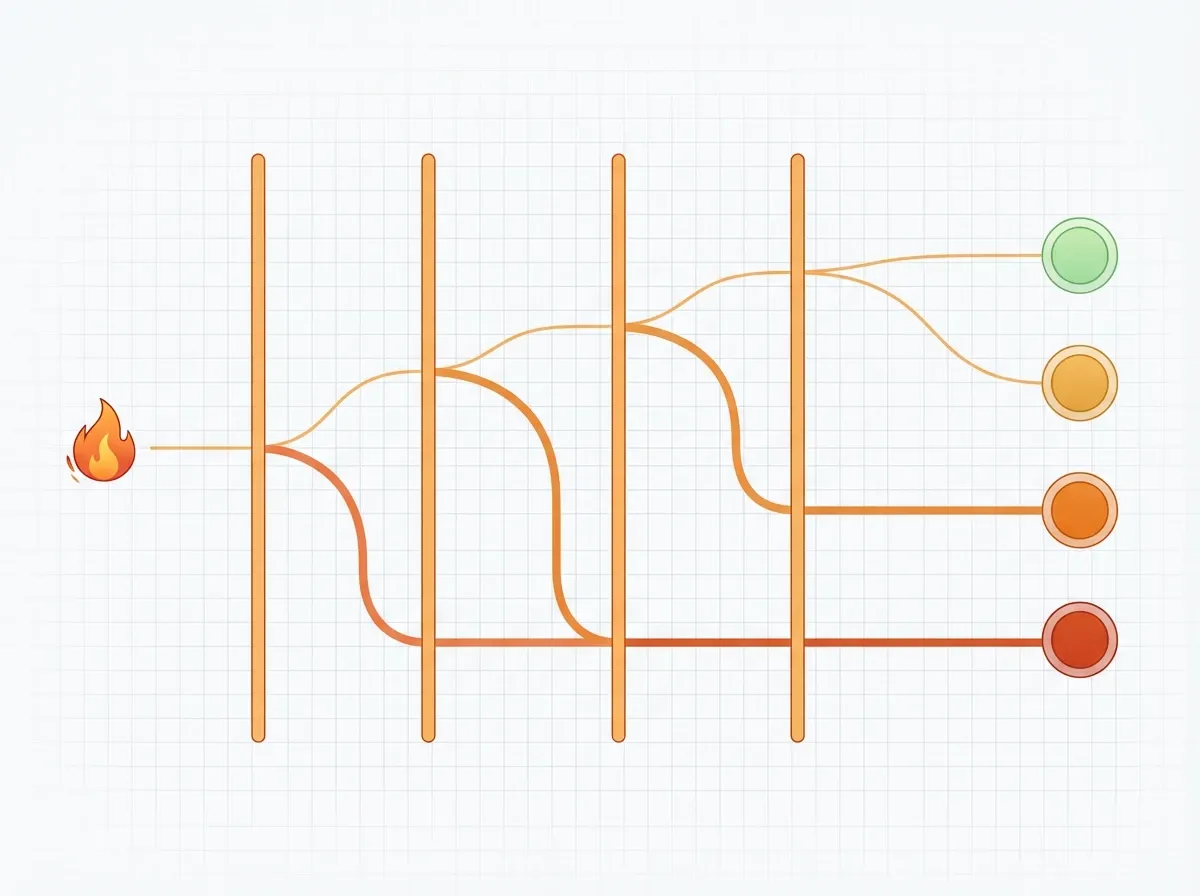
Where a fault tree reasons backward, an event tree reasons forward. First, you pick a trigger — an ignition, a pipe break, a leak. Next, you walk rightward through pivotal events. Each pivot is a safety barrier or a human action. Most branches split in two: success on top, failure below. Finally, you multiply along each path. The result gives the frequency of one specific end state — safe stop, minor fire, flash fire, or explosion.
The strength shows up in time. An event tree reveals how a fire unfolds minute by minute. For example, it shows exactly how much each barrier buys you. However, the weakness is the flip side. The method cannot find the triggers for you; other tools like HAZOP or fault trees must do that first. Also, the clean branch math assumes each pivot stays independent. That assumption often fails in real plants, because barriers share power, sensors, or staff.
Where the two methods differ
The two methods pair up as partners, not rivals. Here is the short form:
| Dimension | Fault tree | Event tree |
|---|---|---|
| Direction | Backward, top-down | Forward, left to right |
| Starts at | One bad top event | One trigger |
| Logic | AND/OR gates | Branch probabilities |
| Best use | Causes and design review | Consequences and barriers |
| Weak spot | No timing, binary only | Needs a known trigger |
In short, a fault tree works like a logic tool. An event tree works like a timeline. Fires are both things that can fail to prevent and events that roll out over minutes. Therefore, most fire studies need both lenses.
Fire applications: sprinklers, suppression, and the bow-tie
On the fault tree side, fire engineers quantify active and passive fire protection. For example, studies in Australian high-rises peg sprinkler reliability at 90–98%. NFPA field data sits around 88–92%. One eye-popping stat: closed main valves drive about 61% of sprinkler failures. That single cut set deserves its own line in every fault tree.
On the event tree side, the canonical fire tool is the Detection-Suppression Event Tree. The NRC and EPRI built it into NUREG/CR-6850. That document underpins risk-informed fire protection under NFPA 805. Given ignition, the tree walks through detection, fixed suppression, the fire brigade, and barriers. The output gives a non-suppression probability as a function of time.
When industry needs both lenses on one page, it uses a bow-tie. The method came out of Imperial Chemical Industries in 1979. Shell then picked it up after Piper Alpha in 1988. A bow-tie puts a top event at the knot. On the left sits a simple fault tree of threats and preventive barriers. On the right sits a simple event tree of outcomes and mitigating barriers. For that reason, the bow-tie now rules UK COMAH and Seveso III safety cases.
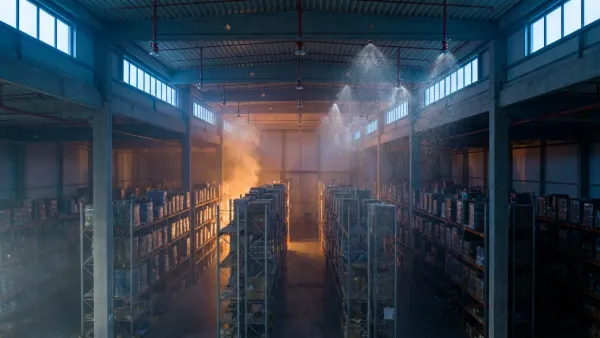
A worked warehouse example
Consider a sprinklered warehouse storing Class III goods. Ignition frequency: 1 × 10⁻² per year. (See our science of fire post for how ignition works.)
Fault tree. The top AND gate pairs ignition with sprinkler failure on demand. The sprinkler sub-tree runs as an OR of five modes. City water out: 0.5%. Pump fails to start: 2%. Main valve closed: 1%. Head fails: 1%. Low pressure: 0.5%. Sum those and you get about 5% sprinkler failure. So the top-event rate lands around 5 × 10⁻⁴ per warehouse-year. That equals one major loss every 2,000 warehouse-years.
Event tree. Take the same ignition as the trigger. Now run it through four barriers: detection (95% success), sprinkler control (95%), evacuation (98%), and brigade intervention (80%). Multiply along each path and roll up into end states:
| End state | Annual frequency |
|---|---|
| Minor fire, sprinkler saves the day | 9.7 × 10⁻³/yr |
| Brigade saves after sprinkler fails | 3.9 × 10⁻⁴/yr |
| Major fire | 1.1 × 10⁻⁴/yr |
| Catastrophic fire with fatalities | 2 × 10⁻⁶/yr |
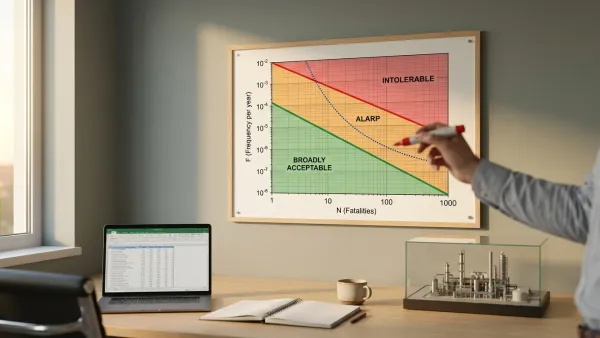
Two insights jump out. First, the paths sum to unity — a useful completeness check. Second, the catastrophic path sits at 2 × 10⁻⁶ per year. That lands right at the edge of the UK HSE “broadly acceptable” risk band. Therefore, even this sprinklered warehouse cannot claim safety without defending that number.
Notice the two methods agree in order of magnitude. However, only the event tree tells you which barrier runs closest to failure. In this example, that barrier turns out to be the fire brigade.
When to pick each method
A simple rule of thumb helps here. First, reach for a fault tree when the question looks causal. Next, grab an event tree when the question looks consequential. Finally, use a bow-tie when the question covers both.
- Pick a fault tree when you dig into one bad outcome — a suppression failure, an egress failure. Also pick it for design-phase hazard work and for reliability budgets on redundant parts.
- Pick an event tree when you want to see how a trigger flows through barriers. Also pick it to produce the consequence frequencies a QRA demands.
- Pick a bow-tie when regulators expect a full risk picture. For example, COMAH, Seveso III, and NFPA 551’s quantitative FRA tier all ask for this.
Tools like NIST’s Fire Dynamics Simulator now plug CFD fire physics straight into these models. Modern fire engineering increasingly runs on that coupling.
Taking home
Fault trees and event trees are not rivals. Rather, they offer two lenses on the same fire. A fault tree zooms in on causes. An event tree walks through consequences. For that reason, refusing to use one because you prefer the other usually signals an incomplete study.
The warehouse example shows why. The fault tree alone gave a 5 × 10⁻⁴/yr loss rate. However, only the event tree revealed the 2 × 10⁻⁶/yr fatality path buried inside it. That path rested on a single pivotal pivot: the fire brigade. Neither diagram produces that insight on its own. Thus, practitioners keep drawing both.
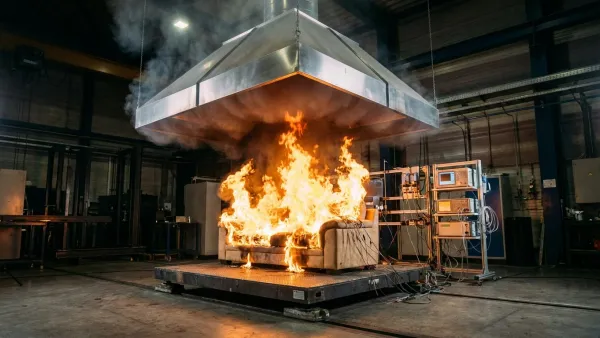
For more on how fires start in the first place, see our science of fire post. For the bench test that feeds these probabilities, see cone calorimeter 101.
Cite this article
Dinh, D. C. (2026, April 18). Event Tree vs Fault Tree: Picking the Right Fire Tool. PyroRisk. https://pyrorisk.net/blog/event-tree-vs-fault-tree/
Recent posts
Featured posts
Categories
Comments
Related posts
F-N Curve and Societal Risk: Drawing the Line on Safety
An F-N curve maps the societal risk a regulator will tolerate. Here is the math, the slope, the ALARP carpet, and where each sector draws the line.
5 Sprinkler Design Mistakes That Cause Catastrophic Fires
The five sprinkler design mistakes that show up again and again in fire loss data — from commodity errors to ESFR clear-zone failures and cold-storage timing.
Heat Release Rate: Why HRR Is the King of Fire Science
Why heat release rate is the single most important number in fire science: how labs measure it, what it predicts, and why it outranks smoke toxicity.