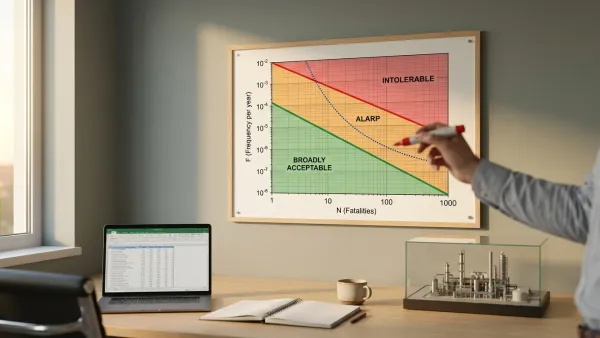
F-N Curve and Societal Risk: Drawing the Line on Safety
An F-N curve maps the societal risk a regulator will tolerate. Here is the math, the slope, the ALARP carpet, and where each sector draws the line.
An F-N curve maps the societal risk a regulator will tolerate. Here is the math, the slope, the ALARP carpet, and where each sector draws the line.
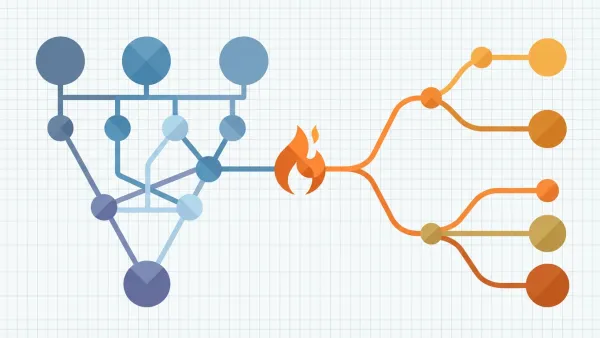
Event tree vs fault tree: one tracks causes backward, the other tracks outcomes forward. Here is how fire engineers pick the right one.
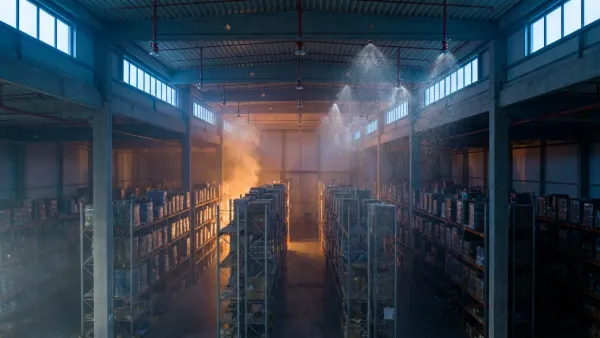
The five sprinkler design mistakes that show up again and again in fire loss data — from commodity errors to ESFR clear-zone failures and cold-storage timing.