The Science of Pyrolysis: How Heat Unmakes Everything
Pyrolysis — heat breaking molecular bonds without oxygen — drives wildfires, battery thermal runaway, biochar, plastic recycling, and even coffee roasting.
Every house fire, every failed lithium-ion battery, every biochar kiln, and every cup of dark-roast coffee shares a single chemical root: pyrolysis. The word comes from Greek — pyr (fire) and lysis (separation). That name fits. Heat tears molecules apart — with no oxygen to turn the reaction into a fire.
So why does this matter? Because pyrolysis sits at the heart of fire science, energy, and materials work. For example, it sets how fast a wall burns. Also, the process drives the cascade of reactions inside a failing battery. Beyond that, pyrolysis powers a growing set of industry tools — from carbon-negative biochar to chemical plastic recycling. This post walks through the chemistry, the kinetics, and the real-world stakes of a core reaction in nature.
What pyrolysis is — and what it isn’t
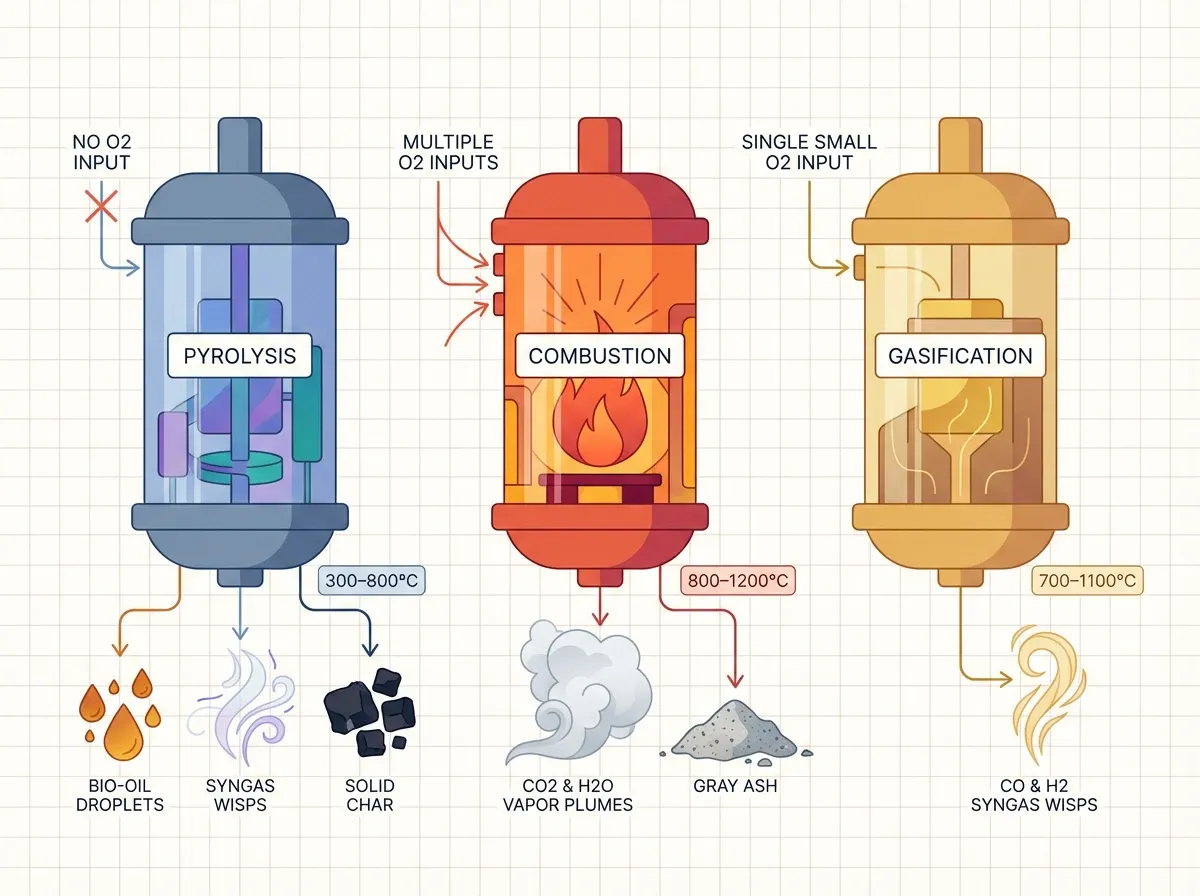
Three related processes all use heat on organic matter: pyrolysis, combustion, and gasification. They differ in how much oxygen is in play. Pyrolysis runs with no oxygen (or as close to zero as possible), usually between 300 °C and 800 °C. It is also endothermic — it takes in energy to break bonds.
Combustion, by contrast, needs excess oxygen. It runs at 700–1,600 °C and is highly exothermic. In short, it gives off energy as carbon dioxide and water. Gasification sits in between. It uses limited (sub-stoichiometric, or less-than-complete) oxygen at 700–1,400 °C. The product is syngas — a mix of carbon monoxide and hydrogen. A fourth kin, torrefaction, is mild pyrolysis at 200–300 °C. It yields a dry, energy-dense solid. For a general overview, see the Britannica entry on pyrolysis and the Wikipedia pyrolysis article.
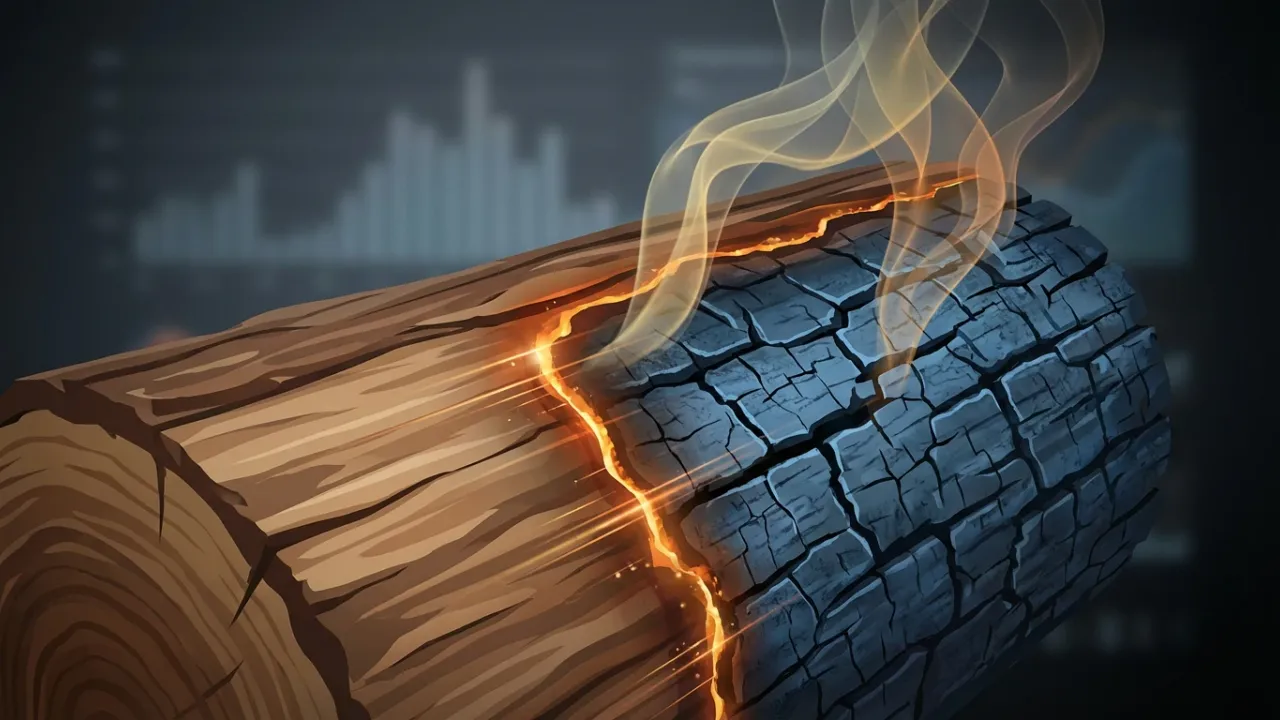
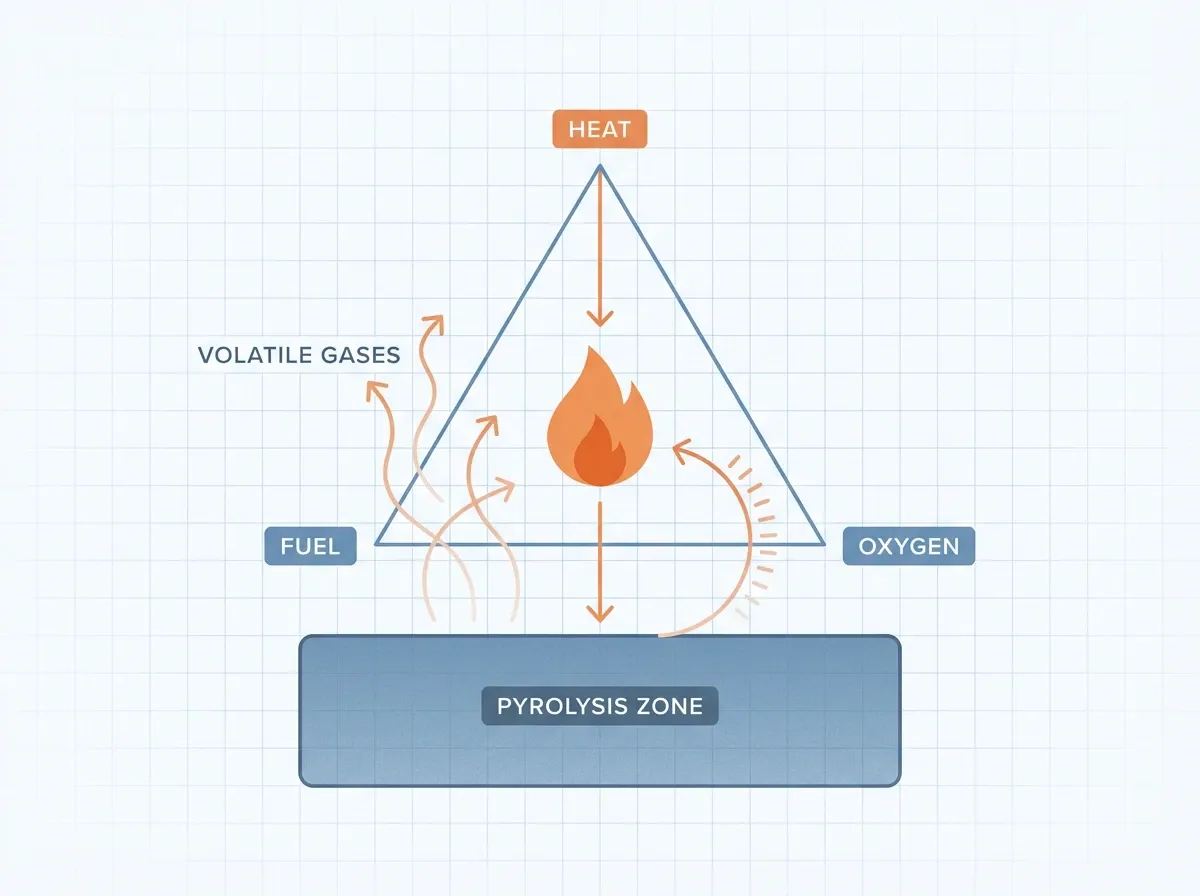
Here is the crucial insight: pyrolysis is the first step in both combustion and gasification. When a log catches fire, the flames are not burning solid wood. First, heat pyrolyzes the wood surface. That releases volatile gases. Those gases then mix with air and ignite. The flame radiates heat back to the wood, which drives more pyrolysis in a self-sustaining loop. In short, solids and liquids do not burn directly — only their gaseous pyrolysis products do. The UL Xplorlabs module on pyrolysis explains this interactively.
Bond-breaking at the molecular level
At its core, pyrolysis is about bond energy — the energy it takes to break a chemical bond. When a material heats up enough, the heat beats the strength of its weakest bonds. Carbon–carbon bonds, at about 350 kJ/mol, break first. Carbon–hydrogen bonds are stronger (~410 kJ/mol). So C–C cleavage leads the early stages.
Bond-breaking follows a free-radical chain. A free radical is a small piece of a molecule with one unpaired electron. That makes it very reactive. The chain has three classic stages.
First, initiation: a covalent bond breaks cleanly down the middle. Two free radicals result. Next, propagation: these radicals pull hydrogen atoms off nearby molecules. They also undergo β-scission — a split one bond over from the radical center. That yields a smaller radical and an alkene. Finally, termination: two radicals meet and quench the chain.
These reactions produce three categories of products:
- Condensable liquids (tar or bio-oil) — complex mixes that are volatile at pyrolysis temperatures but condense back to liquid at room temperature.
- Non-condensable gases — carbon monoxide, carbon dioxide, methane, and hydrogen.
- Solid residue (char) — a carbon-rich material whose carbon content and aromatic structure grow with temperature.
The ratio of these three products depends on three things: temperature, heating rate, and residence time. In other words, those three knobs define every pyrolysis system.
One last key concept: the split between primary and secondary reactions. Primary pyrolysis is the first stage. The raw material turns into volatiles and char. Secondary reactions come later. The tars from stage one can crack further at high heat. That yields lighter gases. They can also link up again to form more char. Colomba Di Blasi’s influential models at the University of Naples track both paths directly (Ranzi et al., 2017 — ACS Sustainable Chemistry & Engineering).
How we model pyrolysis kinetics
So how fast does pyrolysis happen? The Arrhenius equation sets the rate:
Here, is the rate constant. is the pre-exponential factor — how often molecules collide in the right way. is the activation energy — the barrier the reaction must clear. is the gas constant. is absolute temperature.
Together, , , and a reaction model — where is the fractional conversion — form the kinetic triplet. It is the basic description of any thermal breakdown.
Global and multi-component models
The simplest kinetic approach treats a whole material as one global reaction: solid → volatiles + char. This gives one set of kinetic parameters. It is also cheap to compute. However, it cannot capture complex materials that break down in multiple overlapping stages.
Multi-component models improve on that. For example, they treat a material as a sum of pseudo-components. For biomass, that usually means hemicellulose, cellulose, and lignin. Each component then has its own kinetic triplet.
The Distributed Activation Energy Model (DAEM)
For materials with a wide range of bond strengths, the DAEM gives the most realistic description. Vand first proposed the model in 1943. Pitt applied it to coal in 1962. The DAEM treats breakdown as a continuum of parallel first-order reactions. Each reaction has a slightly different activation energy drawn from a probability distribution (usually Gaussian).
Specifically, this model explains why complex materials like coal or lignin show broad, gradual breakdown. A pure compound, in contrast, shows a sharp weight-loss step. For a recent review, see Soria-Verdugo et al. (2024) in ACS Omega.
Isoconversional (model-free) methods
A second family of techniques — isoconversional methods (also called model-free methods) — sidesteps the need to assume any reaction model. These methods run experiments at several heating rates (at least three, per the ICTAC Kinetics Committee recommendations). Then they extract activation energy as a function of conversion.
A few of these methods dominate the field:
- The Friedman method (1964) uses a differential approach. Many researchers consider it the most accurate.
- The Kissinger method (1957) needs only peak temperatures from DSC curves. It has over 12,000 citations — the most popular kinetic method in thermal analysis. However, Sergey Vyazovkin warns that Kissinger can mask process complexity. It can yield linear plots even for multi-step reactions (Vyazovkin, 2020 — Molecules).
- The Flynn–Wall–Ozawa and Kissinger–Akahira–Sunose integral methods sit between the first two in both simplicity and accuracy.
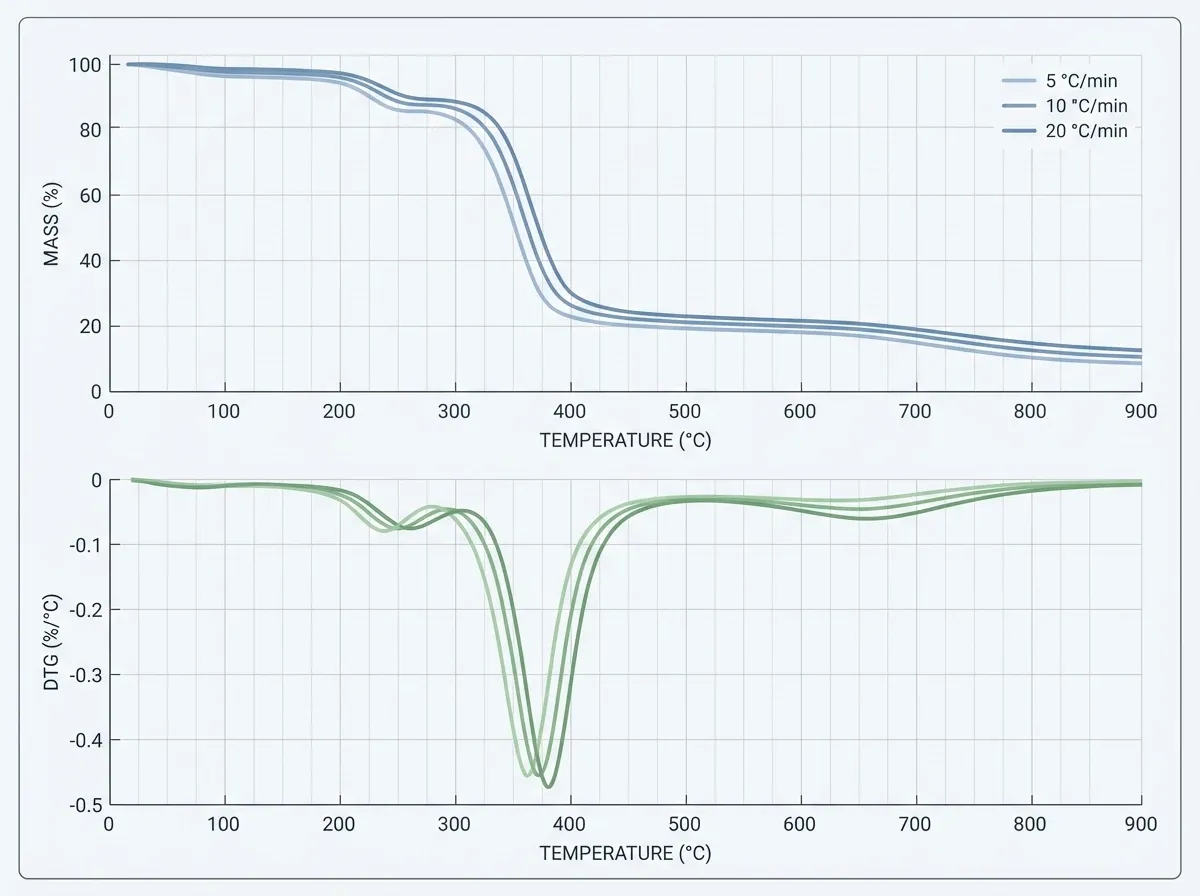
All these methods lean on data from two key tools. Thermogravimetric analysis (TGA) tracks mass loss vs. heat. It gives the typical TG curve and its derivative, the DTG curve. Differential scanning calorimetry (DSC) measures heat flow. It shows whether reactions take in or give off heat. Combined TGA/DSC, often paired with mass spectrometry or FTIR, gives the test foundation for nearly all pyrolysis kinetics work.
Beyond lumped models: coupling solid and gas-phase phenomena
One frontier is to track what happens inside the solid as it breaks down. That means more than global mass loss. It also covers the linked transport of heat and volatile gases. Gases move through tiny pores in the particle. Secondary reactions can even occur before those gases leave the surface. In short, solid–gas effects inside the pores can shift both the product mix and the kinetics we see at larger scales.
Multi-step mechanisms push this further. Shafizadeh’s scheme (wood → char + tar + gas via competing paths) and Miller’s extension (which adds secondary tar cracking) describe wood pyrolysis chemistry far more faithfully than simple parallel reactions. But they raise a subtle math problem. How do you compute the conversion degree for intermediate species — like tar, which primary pyrolysis first produces, and then secondary reactions crack? The standard formula
requires an initial mass . For intermediates, though, that initial mass is not fixed. It builds up as the upstream reaction proceeds.
To fix this, Dinh (2024) introduced the idea of a “virtual initial mass”. The framework gives each intermediate a reference mass. That reference equals what the initial mass would need to be in a single-step breakdown to match the conversion behavior of the coupled multi-step system. So the modeler can track conversion for every species in a complex mechanism under one unified framework — even when species come and go at the same time.
Dinh then put the approach to work. He built a “TGA Calculator” and linked it to the DAKOTA optimization framework (Sandia National Laboratories) for automatic inverse calibration of kinetic parameters against TGA data. The calibrated kinetics then fed into the PATO code (Porous-material Analysis Toolbox, on top of OpenFOAM) for mesoscale simulation of wood pyrolysis at cone calorimeter scale. One key result: secondary intra-pore reactions explain the gap in final mass between TGA and cone calorimeter tests — a long-standing puzzle in the field (Dinh, D.C. (2024), PhD Thesis, ISAE-ENSMA / Université de Poitiers — HAL | theses.fr).
How different materials pyrolyze
First, every material breaks down differently. Here are the five categories that matter most for fire science, recycling, and battery safety.
Biomass and wood
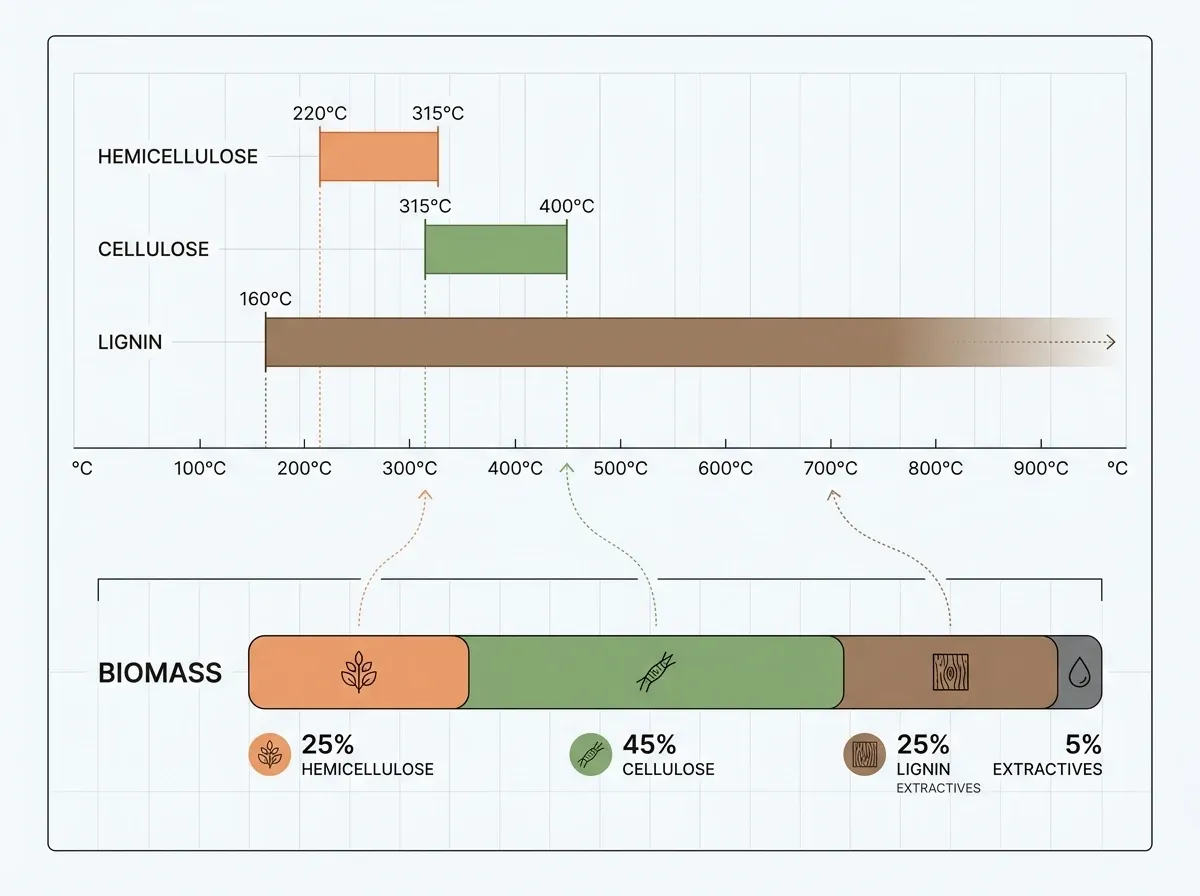
Lignocellulosic biomass is a composite of three biopolymers. Each has its own breakdown behavior:
- Hemicellulose is the most thermally fragile component. It breaks down at 220–315 °C with activation energies of ~110–130 kJ/mol. The products are mostly acetic acid, furfural, and CO₂.
- Cellulose goes through a sharp, well-defined breakdown at 315–400 °C ( ~170–210 kJ/mol). Its signature product is levoglucosan — a six-carbon anhydrosugar formed by transglycosylation (a sugar-ring rearrangement). It can make up to 60 wt% of cellulose fast-pyrolysis products.
- Lignin, the aromatic polymer that gives wood its rigidity, breaks down gradually across a wide 160–900 °C range ( from 46 to 267 kJ/mol). It yields phenolic compounds and the highest char fraction (~40 wt%).
For detailed kinetic data, see Yang et al. (2007) in Fuel and Kim et al. (2020) in Korean Journal of Chemical Engineering.
In practice, operating conditions set which product wins. Slow pyrolysis (<500 °C, minutes to hours) maxes out biochar at 35–60 wt% yield. Fast pyrolysis (500–600 °C, vapor residence under 2 seconds) maxes out bio-oil at 60–75 wt% yield. Flash pyrolysis (>700 °C) favors gases. So the same feedstock can yield soil amendment, liquid fuel, or syngas based on how the reactor runs. That tunability is what makes biomass pyrolysis so versatile.
Polymers and plastics
In general, synthetic polymers follow paths set by their molecular build.
Polyethylene (PE) breaks down at 400–575 °C, mostly by random chain scission. The products span a broad range — waxy alkanes and alkenes at mild heat, lighter oils and gases at higher heat. Activation energy runs about 268 kJ/mol. Monomer recovery is tiny (Murata et al., 1998).
Polypropylene (PP) behaves similarly. However, it breaks down at lower temperatures (onset ~300 °C). Its methyl branches create weaker tertiary carbon centers, which lowers the activation energy to ~220 kJ/mol.
PVC is uniquely problematic. It goes through a two-stage breakdown. First, it releases corrosive HCl gas through dehydrochlorination (loss of HCl from adjacent carbons) at 250–350 °C. It can lose up to 58% of its mass as HCl. Then, above 350 °C, the remaining polyene backbone breaks down into aromatic hydrocarbons. PVC contamination is the bane of plastic recyclers. Chlorine poisons catalysts and taints oils (Miranda et al., 2001).
PMMA (polymethyl methacrylate, or acrylic) is the opposite extreme. Its α-methyl group and ester side chain favor end-chain depolymerization — an “unzipping” path. Monomer units peel off one at a time from chain ends. The result: near-complete monomer recovery, up to 98% MMA purity in tuned fluidized-bed reactors. So PMMA is the textbook example of a polymer built for circular recycling via pyrolysis (Smolders and Baeyens, 2004).
Coal
Coal pyrolysis — once called devolatilization (the shedding of volatile gases) or coking — is one of the oldest industrial uses of pyrolysis. It still matters for steel today.
Specifically, the process follows a well-known path. First, moisture loss below 200 °C. Next, slow breakdown of oxygen-bearing groups at 200–400 °C. Then comes a critical plastic stage at 400–500 °C. The coal softens, volatiles rush out, and the mass sets again into semi-coke. Above 550 °C, secondary reactions drive off hydrogen and methane. Meanwhile, the carbon structure orders into true coke. At 900–1,200 °C, the process yields the strong, low-volatile metallurgical coke that blast furnaces need. Coke yields run 77–80%.
Lithium-ion battery materials
The thermal runaway of lithium-ion batteries is really a cascading pyrolysis event. Understanding each stage matters for battery safety (Chen et al., 2024).
The chain starts at the SEI layer (solid electrolyte interphase) around 80 °C. That opens up the anode to the electrolyte. Then carbonate solvents start to break down above 100 °C. They give off CO₂, CO, and flammable hydrocarbons (Liu et al., 2024).
Polyethylene separators melt at ~130 °C and polypropylene at ~165 °C. That lets the electrodes touch and causes internal short circuits. The most dangerous phase starts above 200 °C. At that point, cathode materials break down and release oxygen. That drives highly exothermic reactions. Throughout the cascade, the PVDF binder breaks down at 350–460 °C. It gives off toxic hydrogen fluoride (HF) gas — a serious hazard for firefighters and first responders.
How severe the cascade is depends on cell format, chemistry, and the kind of abuse that starts the failure. So accurate pyrolysis modeling matters not only for fire prediction, but also for battery safety work.
Everyday pyrolysis: from kitchen to coffee cup
For example, pyrolysis goes far beyond labs and factories. Coffee roasting is one form of it. Beans heat up to 180–250 °C. First, they go through Maillard browning and caramelization. Next, they hit a “first crack” at ~200 °C as steam and CO₂ swell the beans. Above 220 °C, true pyrolysis of the cellulosic bean structure starts. The result is the smoky, bittersweet notes that define a dark roast. Finally, a “second crack” at ~230 °C marks the pyrolysis of the cell walls.
Every time you toast bread, sear a steak, or caramelize sugar above 170 °C, you run small-scale pyrolysis.
Pyrolysis as the engine of fire
In fire science, pyrolysis is the first step in fire and the rate-limiting step. Fuel output from pyrolysis sets fire intensity. One equation captures the link:
Here, is the heat release rate per unit area (HRR). is the mass loss rate — the pyrolysis rate. is the effective heat of combustion of the volatiles. Babrauskas and Peacock’s 1992 paper named HRR as the single most important variable in fire hazard. Since HRR tracks with pyrolysis rate, measuring and predicting pyrolysis is central to fire protection work.
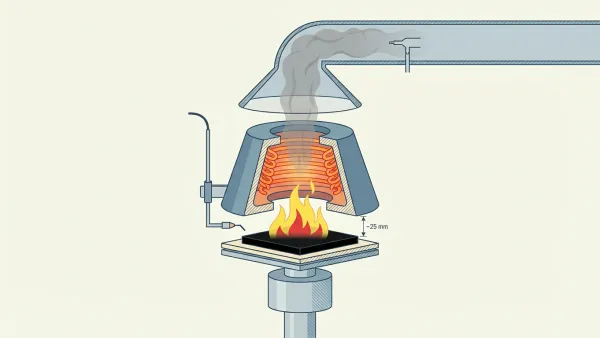
The cone calorimeter is the main bench-scale tool for measuring pyrolysis-driven fire behavior. Vytenis Babrauskas built it at NIST in 1982. ASTM E1354 and ISO 5660 now set the standard. The test puts a sample under a steady radiant heat flux (usually 50 kW/m²). A spark ignites the pyrolysis gases. Then oxygen consumption calorimetry works out HRR, time to ignition, mass loss rate, and smoke output. The method rests on Huggett’s principle: about 13.1 MJ of heat comes out per kilogram of oxygen used (Wikipedia — cone calorimeter).
For material-level screening, the Microscale Combustion Calorimeter (MCC) splits pyrolysis from combustion. Richard Lyon and Richard Walters built it at the FAA. ASTM D7309 sets the standard. A milligram-scale sample pyrolyzes in nitrogen. Then the volatiles flow into a chamber where they burn in excess oxygen. The MCC yields heat release capacity — a basic flammability property that does not depend on sample shape or fire scenario.
Industrial pyrolysis is scaling up
Beyond fire science, pyrolysis powers a growing portfolio of industrial applications.
Biochar and carbon sequestration
Biochar production is perhaps the most transformative use. Pyrolysis locks up roughly 50% of biomass carbon in a form stable for centuries to millennia. That makes it one of the few proven carbon-negative technologies. Biochar carbon credits accounted for 87–92% of all delivered carbon removals in 2022–2023 (Yale e360).
Chemical recycling of plastics
Chemical recycling of plastics via pyrolysis has attracted billions in investment. The concept is simple. Thermally crack mixed plastic waste into pyrolysis oil. Then feed that oil directly into existing petrochemical steam crackers. The result is virgin-quality polymers. Global installed capacity reached about 1 million tonnes per year by the end of 2024. Projections run over 17 million tonnes per year by 2034.
However, the path has been rocky. Multiple facilities closed or declared bankruptcy in 2024–2025 due to technical and economic challenges. Also, feedstock contamination — especially from PVC — remains a persistent problem.
Tire pyrolysis and activated carbon
Tire pyrolysis turns end-of-life tires into pyrolysis oil (43–55% yield, ~42 MJ/kg), recovered carbon black (25–39%), steel wire (~10%), and syngas. Activated carbon production follows a two-step process. First, pyrolysis builds a porous carbon skeleton. Next, physical or chemical activation opens up surface areas above 2,600 m²/g.
Market growth
The pyrolysis oil market sat at about $0.62 billion in 2025. Forecasts put it at $1.53 billion by 2030.
Why pyrolysis matters now
Pyrolysis sits at the crossroads of three urgent global challenges:
- In fire safety, knowing pyrolysis rates and products matters for designing fire-resistant materials, predicting fire behavior, and saving lives. Also, the work grows more urgent as lithium-ion battery fires become more common in electric cars and energy storage.
- In sustainability, the process opens paths to carbon-negative biochar, circular plastic economies, and less waste.
- In innovation, advances in kinetic modeling, catalytic pyrolysis, and reactor design are opening new routes to fuels, chemicals, and materials from waste.
The science itself is mature. For example, the Arrhenius equation is over a century old. Similarly, the DAEM has seen tuning since the 1960s. But the uses are scaling fast. Today, the ICTAC Kinetics Committee keeps setting best practices. Meanwhile, Di Blasi’s group keeps refining transport-coupled models. Also, recent work on beech wood pyrolysis shows the field stays very much alive.
So whether you design fire-safe battery cases, model biomass conversion, or just enjoy a well-roasted coffee, pyrolysis is chemistry worth knowing. It is one of nature’s core changes — and one of our most powerful tools.
For more on flame chemistry, flashover physics, and how this process drives every combustion event, see more fire-science fundamentals on the site.
Key references
Papers on pyrolysis kinetics
- Yang et al. (2007) — Biomass pyrolysis, Fuel.
- Ranzi et al. (2017) — Fast biomass pyrolysis models, ACS Sustainable Chemistry & Engineering.
- Soria-Verdugo et al. (2024) — Improved DAEM, ACS Omega.
- Vyazovkin (2020) — Kissinger method, Molecules.
Polymer and coal studies
- Murata et al. (1998) — PP and PE breakdown, Journal of Analytical and Applied Pyrolysis.
- Miranda et al. (2001) — PVC pyrolysis, Polymer Degradation and Stability.
- Smolders & Baeyens (2004) — PMMA recycling.
Battery thermal runaway
- Chen et al. (2024) — Li-ion runaway, Sustainable Materials and Technologies.
- Liu et al. (2024) — Electrolyte breakdown in runaway, Frontiers in Energy Research.
Standards and core work
- ICTAC Kinetics Committee (2020) — Advice on multi-step kinetics.
- ASTM — Fire and flammability standards (E1354, D7309).
- Dinh, D.C. (2024) — A Detailed Model for Solid Pyrolysis with Solid–Gas Pore Coupling, PhD Thesis, ISAE-ENSMA / Université de Poitiers (HAL | theses.fr).
Cite this article
Dinh, D. C. (2026, April 14). The Science of Pyrolysis: How Heat Unmakes Everything. PyroRisk. https://pyrorisk.net/blog/the-science-of-pyrolysis/
Recent posts
Featured posts
Categories
Comments
Related posts
The Science of Fire: What You Think You Know Is Wrong
Explore the science of fire — from radical chain reactions and flame anatomy to flashover physics and why modern homes burn 7x faster than 1950s ones.
What Is Fire? The Simple, Complete Guide Anyone Can Follow
What is fire? A beginner-friendly guide to combustion, the fire triangle, flame colors, fire classes, and essential home fire safety.
Cone Calorimeter 101: HRR, THR, and MARHE Explained
What the cone calorimeter measures — heat release rate, total heat release, and MARHE — and why each one matters for fire safety.