Heat Release Rate: Why HRR Is the King of Fire Science
Why heat release rate is the single most important number in fire science: how labs measure it, what it predicts, and why it outranks smoke toxicity.
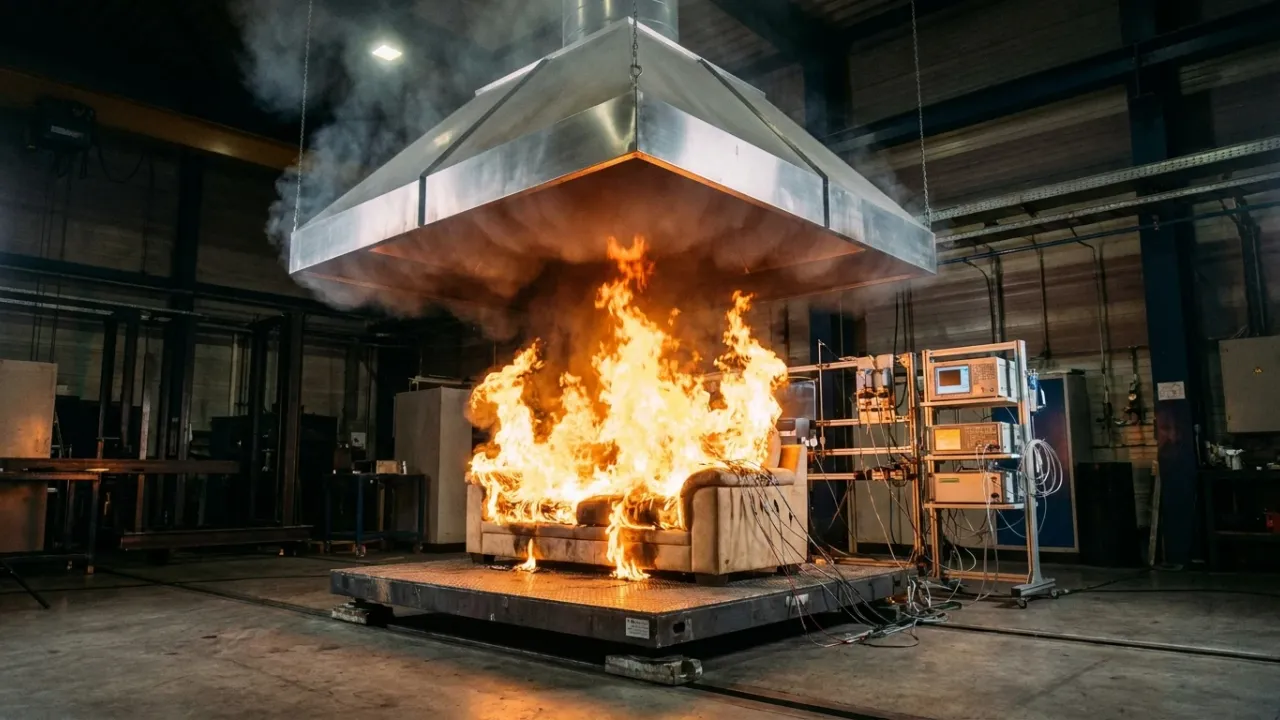
In Cone Calorimeter 101 we took the cone apart and saw how it works. But the cone only serves a bigger goal. The number everyone wants from it is the heat release rate, or HRR — the power output of a fire. Fire scientists call heat release rate the single most important variable in fire hazard. That sounds bold, because most fire victims die from smoke, not heat. Yet the claim has held up for more than thirty years. This post explains why.
TL;DR
- Heat release rate (HRR) means the power of a fire, in kilowatts and megawatts.
- Babrauskas and Peacock named it the single most important fire hazard variable in 1992.
- Labs measure it through oxygen: burning releases about 13.1 MJ per kg of O₂ consumed.
- Flame height, flashover, smoke production, and escape time all follow from HRR.
- Peak HRR spans nine orders of magnitude, from a cigarette to a burning building.
- Toxic potency varies little between products, but HRR varies by a factor of hundreds.
The claim that crowned a metric
In 1992, Vytenis Babrauskas and Richard Peacock published a paper with a blunt title: Heat Release Rate: The Single Most Important Variable in Fire Hazard. Their thesis demoted the classics. Ignition time, they argued, has only a minor effect on how a fire hazard develops. Even smoke toxicity plays a smaller role than most people assume. HRR sits at the top, because it drives everything else.
That hierarchy shocked regulators. For decades, flammability rules obsessed over ignition tests and smoke ratings. So why should one number outrank them all? To see it, stop treating HRR as one property among many. Treat it as the engine of the fire.
What heat release rate actually means
Heat release rate means one thing: the power output of a fire. Specifically, it tracks how fast the fuel’s chemical energy turns into heat. At its simplest,
Here denotes the fuel mass loss rate per unit area, the effective heat of combustion, and the burning area. A bigger drives a taller flame, a hotter plume, faster smoke filling, and more radiant heat onto nearby fuel. More burning also means more soot and more toxic gas.
NIST’s fire dynamics primer offers a lovely illustration. Ten candles burn at the same flame temperature as one candle. However, they release ten times the heat. Temperature tells you how hot. HRR tells you how much — and “how much” decides whether a room stays survivable.
The oxygen trick behind every calorimeter
You cannot easily catch all the heat a fire gives off. So fire science measures something else: the oxygen the fire eats. In 1917, W. M. Thornton noticed that organic fuels release nearly the same heat per kilogram of oxygen consumed. In 1980, Clayton Huggett extended this rule to the solids in real fires. His canonical value still rules the field: 13.1 MJ per kilogram of O₂, within about ±5% for common fuels.
Because that constant barely depends on the fuel, you can compute heat release rate without knowing what burns. You only need an exhaust hood and gas analysers. Best of all, the trick scales. The cone calorimeter handles bench samples up to about 10 kW. Furniture calorimeters and the ISO 9705 room corner test handle whole objects and room linings. At the far end, the NIST 20 MW facility burns vehicles and full assemblies. One principle covers five orders of magnitude.
What HRR predicts
The real power of HRR lies in prediction. Feed it into a few classic correlations and out come the quantities that decide life safety.
Flame height. Heskestad’s correlation ties mean flame height to HRR and fire diameter :
So flame height depends on the two-fifths power of and nothing about the fuel’s chemistry. McCaffrey’s plume correlations work the same way: HRR in, temperature and velocity out.
Flashover. The jump to full-room involvement also hangs on HRR. Thomas’s correlation gives the minimum heat release rate for flashover:
with the internal surface area and the vent term. For a typical residential room, the answer lands near 1 MW. Hence 1 MW recurs everywhere as a benchmark. Past flashover, a single room can release 10 MW or more.
Escape time. In performance-based design, engineers prescribe a design fire as an HRR history. From it they compute the time until heat, smoke, and toxic gases make the room untenable. As a result, every tenability limit falls in step with the growing .
Design fires grow with t-squared
Since HRR feeds every model, engineers need a standard way to prescribe it over time. The universal convention is the t-squared fire:
The fire spreads outward, so the burning area — and the HRR — grows with time squared. Four standard growth classes exist, defined by the time to reach roughly 1 MW. A slow fire takes 600 seconds. A medium fire takes 300, a fast fire 150, and an ultrafast fire just 75. Stacked plastics and upholstered furniture sit at the fast to ultrafast end. These curves live inside NFPA 72, NFPA 92, and ISO 16733-1. Thus one coefficient captures the whole scenario.
From a candle to a car fire
Babrauskas also gave the field a sense of scale. Peak heat release rate spans an astonishing range:
- A candle flame: about 77 W.
- One cigarette lighter: about 75 W.
- Your wastebasket: roughly 50–300 kW.
- An upholstered chair: several hundred kW.
- A sofa: 0.9 to 3.7 MW in furniture calorimeter tests.
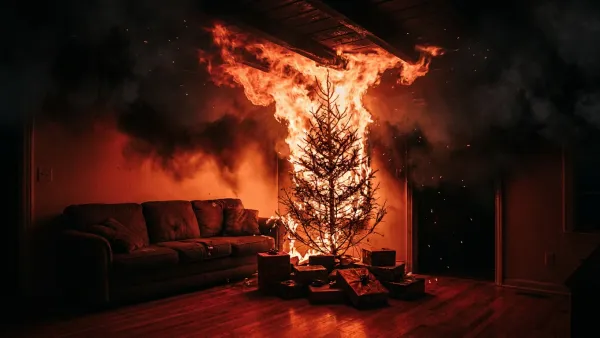
- One dry Christmas tree: a few MW in under a minute.
- A passenger car: 1.5 to 8 MW, per tests at SP Sweden.
- A room past flashover: 10 MW and beyond.
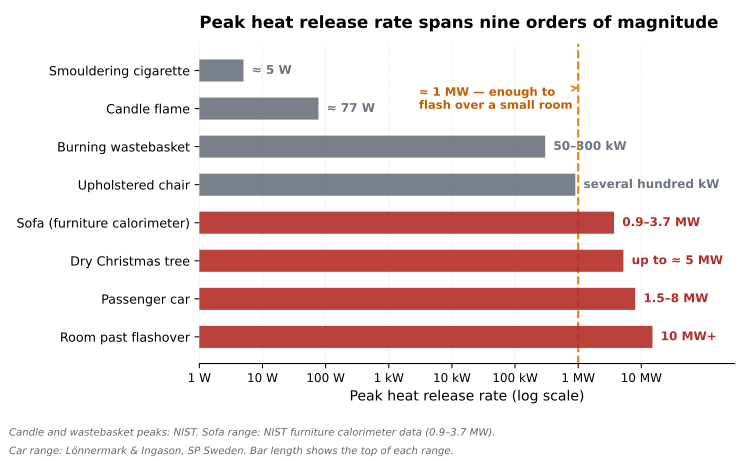
In short, this range carries the whole argument. When one variable spans nine orders of magnitude, it dominates any hazard analysis.
Why toxicity loses the argument
Here comes the sharpest test of the claim. Most fire deaths result from toxic smoke, chiefly carbon monoxide. So why not regulate toxicity directly?
Babrauskas answered with numbers. The dose a victim receives equals toxic potency times the mass of smoke produced. Moreover, mass production tracks HRR almost exactly. And the decisive fact: toxic potency varies within a narrow band across real products. In his full-scale data, the worst product beat the best by a factor of about 8 in potency. For peak heat release rate, that ratio reached roughly 224. In post-flashover fires the potency gap shrinks even further, because CO yield locks in near 0.2 kg per kg.
The conclusion follows fast. Cut HRR and you cut the hazard by a lot. Tweak already-similar toxic potencies and you gain almost nothing. The same logic dispatches ignition time: shaving seconds off ignition barely matters if the item, once alight, releases enormous power.
HRR today: CFD, batteries, and facades
Far from fading, HRR now sits deeper in practice than ever. In Fire Dynamics Simulator, NIST’s open-source CFD code, the simplest way to specify a fire is a heat release rate per unit area on a surface. HRR is literally the primary input to the world’s most used fire model.
Lithium-ion batteries push the metric to its limits. A cell in thermal runaway acts like a small, violent fire, and its HRR governs how failure spreads through a pack. But the oxygen trick strains here: the cathode releases its own oxygen, and much energy leaves as hot ejecta. Willstrand and colleagues report that conventional calorimetry can miss peak HRR for battery fires by up to 100%. Meanwhile, facade tests such as BS 8414 define their fire source by heat output — a wood crib peaking at 3 MW — because heat release, not a material rating, decides whether cladding burns.
Honest caveats
HRR wears the crown, but it rules with limits. First, the curve depends on the scenario. Ventilation, orientation, and ignition spot all reshape , so bench-to-real-scale prediction still carries scatter. Second, toxicity still matters in smouldering or oxygen-starved fires, where little heat flows yet lethal CO builds up. Third, peak HRR alone misses duration. A modest but long fire can release more total heat than a sharp but brief one, so read peak, total, and duration together.
The bottom line
Heat release rate earns its title because it acts as the engine of fire, not just a measurement. Flame height, plume temperature, flashover, smoke, and escape time all flow from . One elegant principle measures it across nine orders of magnitude. And it varies so wildly between products that it swamps every other flammability property. Babrauskas and Peacock called it right in 1992. Three decades of design fires, CFD models, and battery research have only sharpened the verdict. If you can measure one thing about a fire, measure its heat release rate.
Cite this article
Dinh, D. C. (2026, July 3). Heat Release Rate: Why HRR Is the King of Fire Science. PyroRisk. https://pyrorisk.net/blog/heat-release-rate-why-hrr-is-king-of-fire-science/
Recent posts
Featured posts
Categories
Comments
Related posts
Cone Calorimeter 101: HRR, THR, and MARHE Explained
What the cone calorimeter measures — heat release rate, total heat release, and MARHE — and why each one matters for fire safety.
The Science of Fire: What You Think You Know Is Wrong
Explore the science of fire — from radical chain reactions and flame anatomy to flashover physics and why modern homes burn 7x faster than 1950s ones.
Christmas Tree Fire: Flashover in 60 Seconds Explained
A dry Christmas tree fire can hit 7 megawatts and flash a whole room in under a minute. Here is the NIST science, second by second, and why water stops it.