pyrorisk.net · Fire Science & Risk Wildfire Science
Home Hardening: Why Embers, Not Flames, Burn Down Houses
Most homes lost to wildfire never meet the flame front. See how embers get in, what home hardening buys in the field data, and where it stops working.
Online: pyrorisk.net/blog/home-hardening-why-embers-not-flames-burn-down-houses/
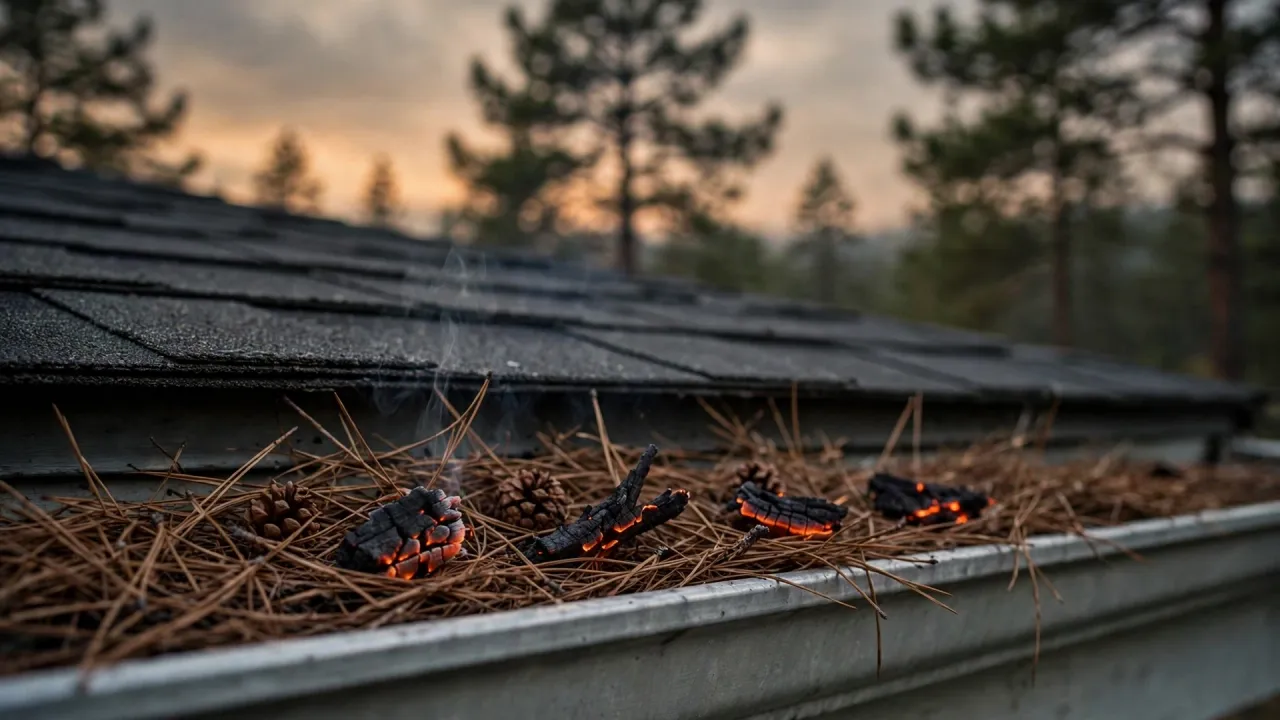
In January 2003, a firestorm ran out of the pine forest west of Canberra into the suburb of Duffy. Afterwards, CSIRO researchers surveyed 229 houses there and worked out how fire had attacked each one. In half the cases, embers alone did it. Embers plus some radiant heat from nearby plants or buildings accounted for another 35%. Yet the flame front itself hit no house in Duffy. Fire after fire shows the same pattern, from Ash Wednesday in 1983 to Los Angeles in 2025. So home hardening, making a house resist embers and the small fires they start, matters more than distance from the forest.
TL;DR
The physics
- A crown fire’s radiant heat fades fast with distance. In Jack Cohen’s tests, walls 10 m from 20 m flames sometimes ignited. None kept burning.
- Embers land far ahead of the front. Most weigh under a gram, yet a small pile can heat wood at about 40 kW/m². And they keep landing after the front passes.
- Embers seldom ignite a wall directly. Instead, they light what sits against it: gutter litter, mulch, fences, sheds and woodpiles.
What works
- Treat home hardening as a system. Combine a Class A roof, tested vents, enclosed eaves and multi-pane glass with a nearly bare first 1.5 m, called Zone 0.
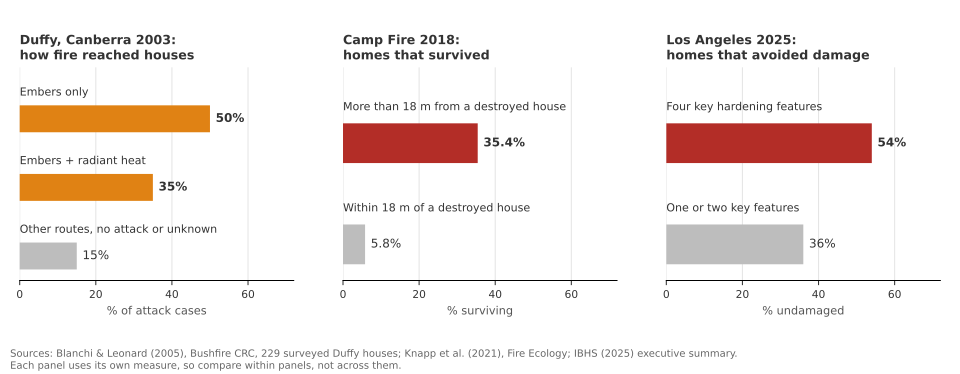
- Features stack. In the 2025 Los Angeles fires, 54% of homes with four key features escaped damage, against 36% with one or two.
- Spacing still dominates in dense suburbs. In the Camp Fire, 5.8% of homes within 18 m of a destroyed house survived, against 35.4% farther away.
Why do embers, not flames, burn down most houses?
A flame front passes in about a minute, and its heat fades within tens of metres. Embers, in contrast, land on and around a house for hours and find every weak spot.
What did Jack Cohen’s crown-fire walls show?
That a crown fire’s heat alone seldom destroys a wall at a distance. Walls 10 m from 20 m flames sometimes ignited, but none kept burning once the front passed.
In the 1990s, Jack Cohen of the US Forest Service asked a plain question. How close must a wildfire come to ignite a wooden wall? First, he built the Structure Ignition Assessment Model (SIAM), which pairs flame radiation with ignition criteria for wood. Then he tested it in the International Crown Fire Modelling Experiment in Canada’s Northwest Territories. His team stood wood walls 10, 20 and 30 m from jack pine stands, then let crown fires with 20 m flames run at them. His 2004 paper reports seven burns.
- At 10 m, walls ignited in three burns, but flames touched only one. Before ignition, heat flux peaked at up to 79 kW/m².
- At 20 m, one burn slightly scorched one panel. At 30 m, nothing happened.
- The heating stayed above 13.1 kW/m², the minimum for piloted ignition, for only 35 to 79 s.
- Afterwards, no wall that ignited kept flaming.
An earlier 2000 summary of five burns had tied every ignition to flame contact. Either way, Cohen concluded that home ignitions are “not likely unless flames and firebrand ignitions occur within 40 meters”. That shrank the problem from the landscape to the house and its surroundings, later called the home ignition zone. That zone became the target of home hardening. In 2023, Cohen and colleagues went further in PNAS, calling these disasters “urban fires initiated by wildfires”.
What do surveys after real fires show?
They also point the same way. Investigators keep finding houses lit by embers and small nearby fires, often long after the front has passed.
After Ash Wednesday in 1983, CSIRO surveyed about 1,150 houses in the Otway Ranges, 720 of them damaged or destroyed. The team concluded that burning debris, meaning embers of bark, twigs and leaves, most often set houses alight. As CSIRO’s Ecos magazine put it, “ember attack rather than attack by flame is the main danger”. Many houses burnt down after the front had passed, sometimes two, three or four hours later.
Twenty years later, Blanchi and Leonard of CSIRO studied the Canberra fires for the Bushfire CRC. Across 229 surveyed houses in Duffy, destroyed and surviving alike, embers alone caused 50% of attack cases. Embers plus some radiant heat from nearby vegetation or other buildings caused another 35%, so 85% involved embers. Radiation from the main front, the authors wrote, “was not sufficient to cause ignition or direct damage”.
Californian data agree. Syphard and Keeley analysed inspection records for more than 40,000 structures from the 2013–2018 fires, in the journal Fire. Building features explained the difference between survival and loss better than defensible-space distance did. The authors suggest why: embers often travel long distances, so clearance distance does little against them. Each survey makes the same case: home hardening beats clearing distant forest.
Is it true that embers cause 90% of home losses?
Not as a measured statistic. The figure comes from a 2019 IBHS press release that cites no dataset. Still, the 85% found in Duffy fits it.
The March 2019 release said embers, or fires they set, first ignited as many as 90% of damaged or destroyed homes. It accompanied a lab demonstration, not a survey, so treat it as an expert estimate that the field data support.
How far does a wildfire’s radiant heat reach?
Not far enough to ignite a wall from beyond about 40 m. Received radiation scales with the view factor, which shrinks roughly with the square of distance once you stand well back.
A wall element receives a radiant flux of:
Here is the flame’s emissive power. The view factor gives the share of that radiation striking the target, and the radiant heat post derives it in full.
Now model the front as a vertical panel of width and height . For a wall element at distance , facing the middle of its base, the view factor reads:
Here and , and the factor 2 counts both halves of the panel. For an element facing the flame’s centre, add four quarters instead: replace the 2 with 4 and with . Once exceeds the flame’s size, falls roughly as .
Worked example: Cohen’s flame from 10 to 60 m
Cohen’s model flame stood 20 m tall and 50 m wide. It radiated as a uniform black body at 1,200 K. So , and kW/m². With = 25 m and = 20 m, the two wall positions receive these fluxes.
| (m) | Facing base | Facing centre | Cohen 2004 |
|---|---|---|---|
| 10 | 50 | 81 | 79 |
| 20 | 36 | 46 | 45 |
| 30 | 24 | 28 | 27 |
| 40 | 17 | 18 | – |
| 60 | 9 | 9 | – |
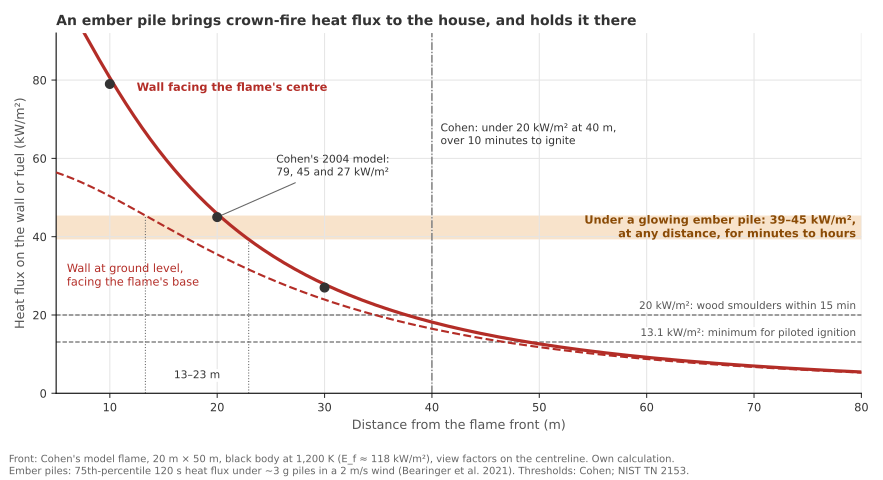
All values sit in kW/m². The centre column reproduces Cohen’s 2004 model within 2 kW/m². Both columns also fall below 20 kW/m² at 40 m. There, his 2000 paper puts the minimum piloted ignition time at “more than 10 minutes”. Yet no crown front lingers that long. So the front’s radiation can scorch a wall, or briefly ignite it at close range. But it cannot burn a house down from afar. For home hardening, then, the flame front matters less than what burns within a few metres of the walls.
How do embers travel and pile up?
Wind lofts burning bark, twigs and building debris and drops them far ahead of the front. Most weigh under a gram, and they gather wherever the wind slows: corners, gutters, wall bases and fences.
Firebrands, as engineers call embers, come from plants and, in suburbs, from burning buildings. In a Japanese wind tunnel, Suzuki, Manzello and Hayashi burned wall sections of OSB on wood studs. Across three tests, 84–98% of the firebrands they caught weighed under 1 g. Burn marks from the 2007 Angora Fire also pointed to small firebrands, under 0.5 cm² in projected area.
A single ember rarely ignites anything. But accumulation does the damage. In NIST’s wind tunnel work, an obstacle created a stagnation plane where numerous firebrands piled up. That explains why corners, gutters, deck joints and wall bases keep turning up in post-fire surveys. Home hardening starts at those spots. Likewise, in NIST’s firewood tests, the building itself created upward flow and a vortex that dropped firebrands beside it.
Embers also outrun the front by kilometres. In the 2018 Camp Fire, NIST mapped 30 spot fires before 08:30, reaching as far as 3.4 km into Paradise. So a town can burn from the inside while the flame front still sits in the canyon.
How does a pile of embers ignite a house?
By smouldering into whatever it lands on. A few grams of embers can heat the wood beneath them at about 40 kW/m², for far longer than a front.
A pile of glowing embers heats the surface under it mainly by conduction, plus radiation within the pile. Salehizadeh, Hakes and Gollner tested when wood ignites under such piles. Three factors proved critical: wind speed, pile mass and, above all, the density of the wood underneath. In addition, ignition happened while the heating from the pile was still rising.
Bearinger and co-authors then measured that heating under piles of about 3 g in a 2 m/s wind. The upper quartile of their 120 s averages reached 39.3 kW/m² for hardwood and 45.4 kW/m² for softwood. Yet that gap sat within the scatter. Both values sit far above the classic piloted-ignition thresholds for wood. Crevices also make it worse. In tests by Richter and co-authors, a wooden crevice took significantly more heat from a smouldering pile than a flat board.
NIST’s review of structural wood products, Technical Note 2153, collects the matching thresholds. It cites cone tests by Bilbao and co-workers, where wood needed at least 20 kW/m² to smoulder within 900 s. The critical surface temperature was 300 °C. It also cites bushfire tests on timber bridges, where 7 g of embers in a 10 mm gap lit smouldering. Once wood smoulders, a gust can turn it to flame, as the smouldering vs flaming post explains. Home hardening therefore aims to deny embers a bed, with nothing that burns where they settle.
Worked comparison: an ember pile against a distant front
Now set the two hazards side by side. Solve for each pile flux, at both wall positions.
- 45.4 kW/m² (softwood) matches the front at about 13 m facing the base. Facing the centre, it matches at 20 m.
- 39.3 kW/m² (hardwood) matches it at about 17 m, or 23 m.
So a few grams of embers bring a crown fire within 13 to 23 m of the wall. But they do it on the deck or in the gutter, for minutes to hours, not one minute. Their heating also ignores distance to the front; it depends only on where embers land and pile up. The comparison stays loose: a pile heats a small patch by conduction, while a front bathes a whole wall in radiation. Still, that contrast forms the physical core of the “embers, not flames” argument.
Why don’t vent screens stop embers?
Because embers keep burning until they shrink enough to pass through. In wind tunnel tests, firebrands got through every mesh tried, down to openings of 1.04 mm.
Vents show how home hardening moved from rules of thumb to tests. California’s 2007 building code, in Chapter 7A, allowed vents behind 1/4 in (6 mm) wire mesh. As NIST later noted, that size “was not based on any scientific testing”. So Manzello’s team ran full-scale tests with mesh openings from 5.72 mm down to 1.04 mm. No mesh quenched the firebrands; they burned on until small enough to slip through. Behind the mesh, cotton ignited at every size. The authors concluded that mesh “was not effective in reducing ignition for the fine fuels tested”.
The arithmetic shows why. A firebrand of 0.5 cm², or 50 mm², has an equivalent square side of mm. To pass 1/8 in (3.2 mm) mesh, it must burn down to under half its linear size. That delays intrusion, but it cannot prevent it.
Later, IBHS tests on gable and eave vents concluded that 1/4 in mesh “should not be used to cover any vent”. IBHS preferred 1/8 or 1/16 in. Vents in open eaves also fared worse than vents in enclosed soffits.
Today, ASTM E2886 tests whole wall, gable, foundation and eave vents against embers and flame. However, it sets no pass marks itself. California’s 2025 Wildland-Urban Interface Code supplies three. Cotton behind the vent must not flame in the ember test, and nothing may flame in the flame test’s integrity check. The unexposed side must also stay at or below 350 °C. Mesh of 1/16 to 1/8 in survives only for ridge and other sloped-roof vents. Australia’s AS 3959 sticks with mesh: corrosion-resistant, with openings of 2 mm at most.
Which parts of a house fail first?
The first 1.5 m around the walls, then the roof and gutters, then the vents. Attached fences and decks, windows and siding, and firewood piles follow.
| Rank | Weak spot | How embers win |
|---|---|---|
| 1 | Zone 0: mulch, shrubs, furniture, bins | Spot fire grows into flame on the wall |
| 2 | Roof covering and gutters | Embers pile in shakes, valleys and litter |
| 3 | Gable, eave and foundation vents | Embers enter the attic or crawlspace |
| 4 | Attached fences, decks, timbers | A wick of fuel carries fire to the wall |
| 5 | Windows, eaves and siding | Glass breaks under heat from nearby fires |
| 6 | Firewood piles and sheds | A spot fire starts next to the wall |
That ranking sets the order of home hardening work, from the ground up. For example, in Los Angeles, IBHS found that hot tubs, patio furniture and bins within 1.5 m “repeatedly served as connective fuels”. Similarly, NIST’s fence and mulch tests found that “combustible fences can be rapid conduits for fire”.
In the Camp Fire, NIST’s case study logged 16 ignition pathways that witnesses saw directly. Nearly all ran through burning fuel within a few metres: sheds, fences, mulch, cars, boats, junipers and a woodpile. Only one ran from a neighbouring house, 11 m away. In other words, houses usually caught from something burning right beside them.
Roofs fail too. Firebrands blown under ceramic roof tiles smouldered into the OSB deck below. Without underlayment or bird stops, they burned through to flaming. In NIST’s fence tests, a steel-plastic composite fence melted and dripped, producing large flames. Finally, many survivors came close. In Paradise, a study of 310 damaged survivors found window damage on about 41% and wall damage on 53%.
What happens once houses start igniting each other?
The fire turns urban. Because a burning house radiates at neighbours a few metres away, spacing predicts survival best in dense suburbs.
In the 2007 Witch and Guejito fires, spread within communities ran mainly from structure to structure. In the 2012 Waldo Canyon Fire, houses 3 to 6 m apart ignited each other. NIST experiments also explain why. With two structures 1.8 m apart, heat flux on the facing wall peaked at 60 to 110 kW/m². Fire spread mostly through broken windows.
In the Camp Fire, Knapp and co-authors studied single-family homes in Paradise, in Fire Ecology. Distance to the nearest destroyed structure predicted survival best, with a threshold at 18 m. Homes farther than that survived with probability 0.354, against 0.058 for homes closer in, a ratio of about six. Moreover, most damage on survivors appeared to come from radiant heat of burning neighbours, or from direct flame. A 2025 Nature Communications model of five fires agreed. It called structure separation distance “the single strongest driver of predicted loss”.
Lahaina in 2023 showed the extreme case, with houses as little as 6 ft (1.8 m) apart and hurricane-force winds. So no amount of home hardening on one lot fixes that geometry.
Does home hardening actually work?
Yes, as better odds rather than a guarantee. Hardened homes survive more often in every large dataset. The gains also stack: features work best together and with a clear Zone 0.
The IBHS survey of the 2025 Los Angeles fires covered 252 structures, plus CAL FIRE data on over 30,000. Four features stood out: a Class A roof, noncombustible siding, double-pane windows and enclosed eaves. Homes with all four escaped damage 54% of the time, but only 36% with one or two. Meanwhile, according to the executive summary, over 25% fuel cover in Zone 0 pushed damage risk to 87–100%. Separation still mattered. With a neighbour within 10 ft (3 m), even four-feature homes had under a 50% chance of escaping damage.
In damage terms, the probability falls from 64% to 46%, a relative cut of about 28%. That helps a lot, yet separation changed survival six-fold in Paradise. So hardening shifts the odds most where houses stand apart. But it cannot fully offset a neighbour burning a few metres away.
Model results also favour home hardening, with a twist. The Nature Communications study, led by Zamanialaei and Gollner, reached 82% accuracy in predicting which homes burned. Its scenarios leave out firefighting, so they serve as theoretical estimates.
| Scenario | Modelled survival |
|---|---|
| No mitigation | 20% |
| Hardening only | 25% |
| Clear Zone 0 only | 37% |
| Hardening and clear Zone 0 | 40% |
| Hardening and clear 0–9 m | 48% |
So a clear Zone 0 did more than hardening alone, and the two together doubled survival. Build age tells a similar story. In Knapp’s sample of 400 Paradise homes, 11.5% of those built before 1997 survived, against 38.5% of newer ones.
People matter too. For the Camp Fire, Troy and co-authors failed “to find a consistent and significant reduction” in loss from defensible space. Yet defensive action by firefighters mattered more than any other factor in one set of their models. Many houses ignite after the front has passed, so someone putting out spot fires can save them. That only works where firefighters stay safe, and it never justifies ignoring an evacuation order.
What do building codes require for ember resistance?
California and Australia write ember resistance into construction rules. Most others, France included, regulate vegetation clearance instead, so vents, gutters and the ground by the walls stay uncovered.
California’s Zone 0 rules show how slowly home hardening turns into law. The Board of Forestry adopted emergency regulations on 19 August 2026. Yet OAL records show the package withdrawn on 8 September, and the Board plans to resubmit revised text. So nothing is in force yet. Even so, the adopted text shows the direction: no new combustible fences within 5 ft of a house.
Voluntary standards move faster. In June 2026, IBHS renamed the two levels of its Wildfire Prepared Home standard. Essential covers the roof, gutters, vents and a noncombustible first 5 ft, while Enhanced adds eaves, glazing and siding.
Meanwhile, Australia’s standard treats embers as the baseline. Under AS 3959, even BAL-12.5, the lowest construction level, assumes significant ember attack and up to 12.5 kW/m². By contrast, France’s obligations légales de débroussaillement require clearing 50 m around buildings near forests. A mayor can extend that to 100 m, and a law of 10 July 2023 tightened enforcement. Yet ember rules for the buildings themselves appear only in some local fire-risk plans.
How much does home hardening cost?
Home hardening costs little in a new home, and much more as a retrofit.
A 2018 Headwaters Economics and IBHS study priced a home in southwest Montana. Built to wildfire-resistant codes, it cost roughly the same as a typical home. Their 2022 California edition started from a home that already met Chapter 7A. An “Enhanced” upgrade added about $2,800, while an “Optimum” one added $18,180 in northern California and $27,080 in the south.
Retrofits cost more, because home hardening on an existing house replaces working parts. Headwaters’ 2024 retrofit report prices a metal gutter and guard along one side at about $930. A full retrofit ran from $23,000 to over $100,000, depending on the level.
Insurers and regulators have also started to count the benefit. In March 2026, California’s insurance department publicised a modelling study. Rebuilding Los Angeles homes to the IBHS standard could cut average annual losses by 31–35%. Its Safer from Wildfires rule makes insurers that price wildfire risk credit Class A roofs, ember-resistant vents and similar measures.
What should a homeowner do first?
Home hardening starts at the ground and the roofline. Clear the first 1.5 m, clean and guard the gutters, then fix the vents. Save costly envelope upgrades for when parts need replacing anyway.
-
Make Zone 0 nearly bare. Swap bark mulch for gravel or pavers. Move shrubs, furniture, bins and firewood away from the walls. Keep fuel cover near zero; IBHS tied 25% to 87–100% damage risk.
-
Fix the roof and gutters. Use a Class A roof and noncombustible gutters with guards. Clear needles and leaves before fire season and on red-flag days.
-
Replace open vents. Where codes allow mesh, use metal mesh of 1/8 in (3.2 mm) or finer, or 2 mm under AS 3959. Better still, fit vents tested to ASTM E2886.
-
Cut the wicks. Make the last 1.5 m of attached fences and gates noncombustible. Enclose or clear under decks, and remove landscape timbers near walls.
-
Upgrade the envelope at replacement time. Fit multi-pane tempered glass, enclosed eaves and noncombustible siding. If a neighbour stands within about 6 m, start with the facing wall.
-
Plan to leave. Follow evacuation orders. NIST warns that current houses are “not built to a standard where passive sheltering is a reliable way to survive”.
What should engineers and code writers take from this?
Treat ember hardening as the floor and separation as the scale. In my assessment, three changes would close the largest gaps.
First, harden fully or expect little. NIST’s hazard mitigation methodology states that “hardening for embers is required in all scenarios”, whatever the spacing. Partial ember hardening, it warns, adds “almost no value in high exposure conditions”. Second, screen neighbourhoods with the 18 m Camp Fire threshold. Where houses stand within about 6 m, require rated walls and glazing on facing sides. Third, test what the field data blame. For example, NIST wants fence fire tests that “represent the actual fire hazard”.
What are the limits of this evidence?
Post-fire data carry real uncertainty. Inspectors record features of buildings that may have burned to the ground. So “ember-caused” often means “no sign of flame-front contact”, not a direct observation.
Several other caveats apply to the home hardening evidence. Single factors explain little of the variation in California’s inspection data, so chance plays a part. Also, in extreme wind, ember showers and house-to-house spread can overwhelm both defensible space and hardening. The evidence leans heavily on California and Australia. Mediterranean houses with masonry walls and tile roofs differ, though tiles do not keep embers off the deck below. Finally, I computed the view-factor numbers myself from Cohen’s model flame. The Zone 0 status reflects public records in late October 2026.
Key takeaways
Wildfires destroy most homes from inside their own yards. The flame front brings about a minute of radiant heat that fades within tens of metres. Embers, in contrast, bring hours of small attacks on gutters, vents, mulch and fences.
So home hardening works as a chain, and the weakest link sets the outcome. A Class A roof means little above a bark-mulch bed against a timber wall. Yet the IBHS data show the gains stacking as features add up.
Distance still matters, but at the scale of the street. Once houses burn, they radiate at each other, and separation outweighs any single upgrade. Home hardening shifts the odds for each house, while spacing and community-wide action decide whether a suburb survives.
Cite this articleHow to cite
Dinh, D. C. (2026, October 24). Home Hardening: Why Embers, Not Flames, Burn Down Houses. PyroRisk. https://pyrorisk.net/blog/home-hardening-why-embers-not-flames-burn-down-houses/
Recent posts
Featured posts
Categories
Comments
Related posts
Fire Fundamentals
What Is Fire? The Simple, Complete Guide Anyone Can Follow
What is fire? A beginner-friendly guide to combustion, the fire triangle, flame colors, fire classes, and essential home fire safety.